Objective
Analyze InstaCart’s user data by conducting an initial data and exploratory analysis and applying machine learning models in order to derive insights and suggestions for InstaCart’s upcoming marketing campaign, as well as to increase overall sales for the company.
InstaCart Basket Analysis
Introduction
Tools
Python | Data wrangling, creating visualizations, and machine learning in Python using libraries such as pandas, seaborn, and sklearn
Excel | Report creation
Jupyter | Markup and notebook management
Python | Data wrangling, creating visualizations, and machine learning in Python using libraries such as pandas, seaborn, and sklearn
Excel | Report creation
Jupyter | Markup and notebook management
Data & Limitations
The data that was used for this analysis was published as open source from InstaCart and can be found here. The customer and demographic data was fabricated for the purpose of this analysis and can be downloaded here.
Our analysis is limited in part by the fabrication of customer data. In addition, the dataset is only from 2017 and so it hinders any kind of temporal analysis as well as any efforts to mitigate any temporal bias. Lastly, there is limited customer data, thus only so many customer profiles were made.
Methodology
Data Cleaning & Merging
This project began like many others with data cleaning and merging data sets. While the data was quite clean for the most part, there were some slight challenges merging the datasets due to the sheer quantity of data. The full steps of this phase are documented in the Excel report found on my Github.
This project began like many others with data cleaning and merging data sets. While the data was quite clean for the most part, there were some slight challenges merging the datasets due to the sheer quantity of data. The full steps of this phase are documented in the Excel report found on my Github.
Customer & Store Profiling
After the final dataset was created, I began to create some analysis variables (e.g. customer loyalty, product price category, and spender type) in order to better explore the customer base and basic store statistics. Many other analysis variables would be made during the course of this project, including ones that would profile customers into different categories (e.g. pet owner, vegetarian).
After the final dataset was created, I began to create some analysis variables (e.g. customer loyalty, product price category, and spender type) in order to better explore the customer base and basic store statistics. Many other analysis variables would be made during the course of this project, including ones that would profile customers into different categories (e.g. pet owner, vegetarian).
Visualizations
Once the variables were set, I began to visualize the data to both try to find some insights and to spot any issues I’d have to deal with in the next step. Various kinds of graphs were made, including the ones seen below.
Once the variables were set, I began to visualize the data to both try to find some insights and to spot any issues I’d have to deal with in the next step. Various kinds of graphs were made, including the ones seen below.
Machine Learning
The last part of the project was definitely the most interesting and challenging for me. The first half comprises the use of an XGBoost Classifier algorithm that tries to see which characteristics lead a user to be a high or a low spender. The second half is a market basket analysis using an apriori algorithm.
With the XGBoost Classifier algorithm, I was hoping to uncover which characteristics of a user are associated with being a high spender, so that InstaCart would be able to better target those kinds of users. Although the results are not the best, I think that it was still a good exercise for myself since I learned a lot about the application of and preprocessing necessary for machine learning.
The second half was an extension of work done by a data scientist as specified in my Github. My aim was to generate a three item association rule list so that InstaCart could better their recommendation list and in turn sell more products. This process definitely tested my Python skills, and while it was quite difficult I found the process to be fascinating and informative.
Results
Deliverable
The deliverables of this project came in the form of an Excel report.
The deliverables of this project came in the form of an Excel report.
Main Insights
The following are some insights developed throughout the course of the project:
“The highest departments by order frequency, in order, are: produce, dairy eggs, snacks, beverages, and frozen.
Since our users buy a lot of items that require extra care when delivering, like eggs and frozen items. We should ensure that we are taking the proper precautions and measures in delivering these items, and let the user know of these measures and precautions.
Our users also buy many items that seem to be consumed on a weekly basis, or have a shorter shelf life, like produce, so we could consider allowing the user to create a subscription ordering method so they can get set orders every week.”
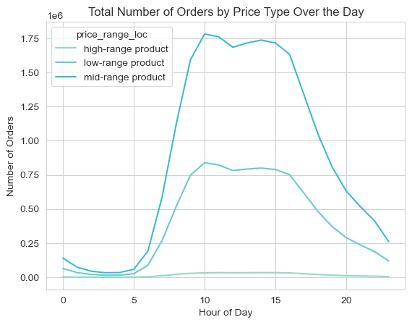
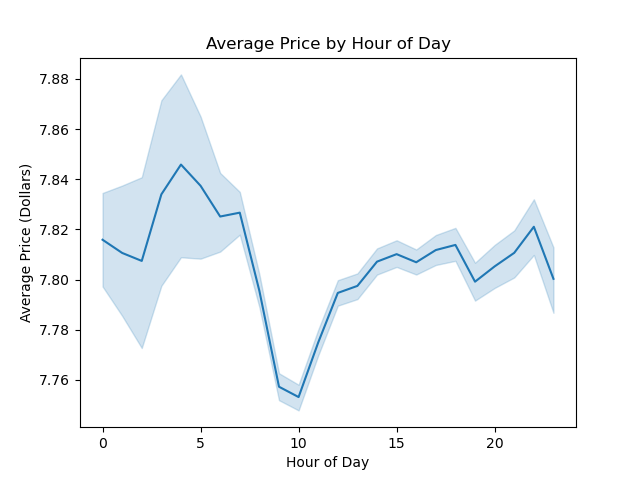
“In terms of price of item, users tend to buy higher priced items between the hours of 12am to 6am and from 5pm to 11pm
In terms of the quantity of higher priced items bought, users buy the most quantity between 10am to 3pm.
Lastly, in terms of median cost of order, users spend the most money between 7pm and 11pm.
As shown in the visualizations tab, we would want to advertise mid-range products during the day, from 8am to 5pm. While advertising more expensive products either in the early morning or later at night (after 7pm).”
The following are some insights developed throughout the course of the project:
“The highest departments by order frequency, in order, are: produce, dairy eggs, snacks, beverages, and frozen.
Since our users buy a lot of items that require extra care when delivering, like eggs and frozen items. We should ensure that we are taking the proper precautions and measures in delivering these items, and let the user know of these measures and precautions.
Our users also buy many items that seem to be consumed on a weekly basis, or have a shorter shelf life, like produce, so we could consider allowing the user to create a subscription ordering method so they can get set orders every week.”
“In terms of price of item, users tend to buy higher priced items between the hours of 12am to 6am and from 5pm to 11pm
In terms of the quantity of higher priced items bought, users buy the most quantity between 10am to 3pm.
Lastly, in terms of median cost of order, users spend the most money between 7pm and 11pm.
As shown in the visualizations tab, we would want to advertise mid-range products during the day, from 8am to 5pm. While advertising more expensive products either in the early morning or later at night (after 7pm).”