Visualizations
Below is a collection of visualizations that I have made across various platforms and using different tools. My own little gallery if you will.
Visualizing Californian Wildfires
R | 2022
This was a visualization I created during a Data Hackathon. This gif, made using R, tracks the number and size of wildfires that happened in California from 2013-2021.
This was a visualization I created during a Data Hackathon. This gif, made using R, tracks the number and size of wildfires that happened in California from 2013-2021.
Visualizing San Francisco Restaurant Health Scores
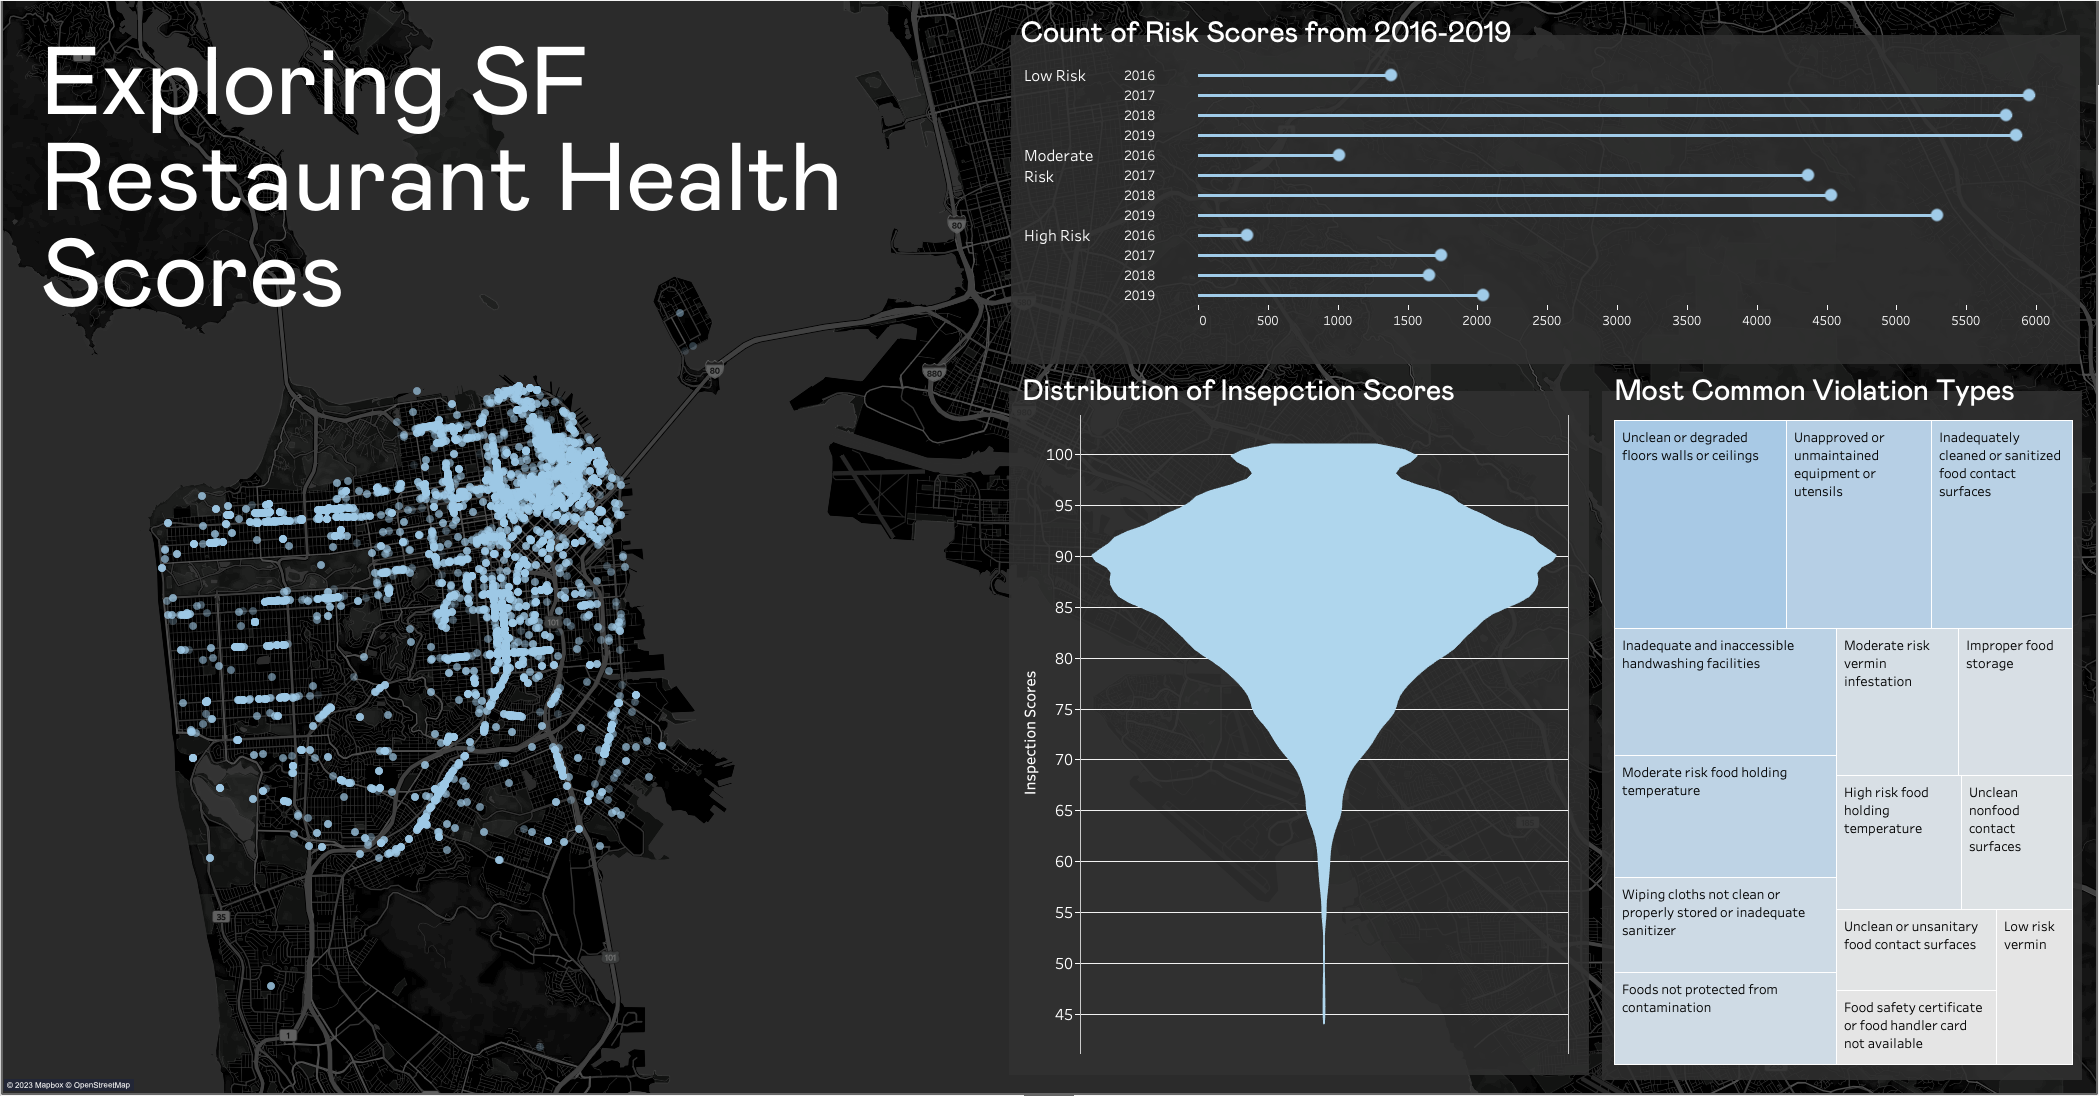
Tableau | 2023
With this visualization I aimed at practicing stylizing and creating new graphs in Tableau.
With this visualization I aimed at practicing stylizing and creating new graphs in Tableau.